Sorry for the limited posting of late — the day job has been ramping up to a big milestone and I’m now beginning the process of a cross-country move. I hope everyone enjoyed the free book weekend. Over 200 were distributed!
The latest employment situation data is still showing the lowest unemployment rates since the late 60s, and “core” unemployment1 has at least paused its climb. If it returned to the equilibrium rate of decline now, it would be one of the littlest recessions on record2:
Looking at headline unemployment, there isn’t much to see:
My gut feeling say the climb isn’t over and we’re just seeing a statistical fluctuation. The rise in core unemployment is still fairly consistent with the rate of rise in the early 2000s recession:
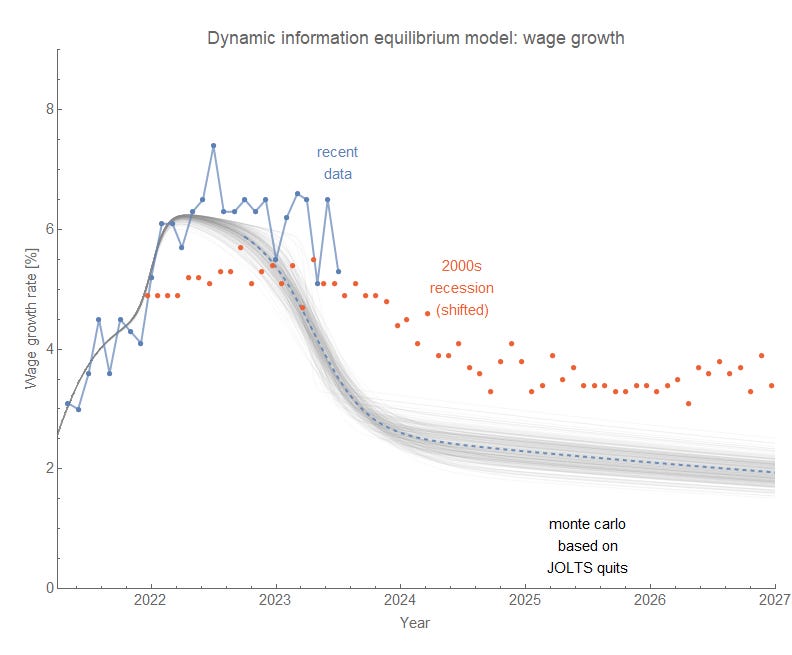
It’s still much slower than would be anticipated by JOLTS hires data — that could mean there is a natural scale for the width (i.e. duration) of a shock to unemployment. In fact, all previous recessions show a width parameter3 of b = 0.3 y to 0.4 y while the recent shock to hires shows roughly half that at b = 0.2 y. The same basic story applies to wage growth, too:
Earlier this week, Brad DeLong noted that quits was still doing well with regard to matching the employment cost index. However the employment cost index is extremely noisy (and reported only quarterly) relative to the Atlanta Fed wage growth tracker — which is why I tend to use the latter (though both show basically the same information4).
While the match is slightly better, using quits instead of hires still shows the issue that the JOLTS shocks are extremely narrow, historically speaking5.
Here’s the quits-based forecast of the (core) unemployment rate graph above which shows the same too-rapid rise:
There are still signs of a forthcoming shock to unemployment, but it’s only the last six months of data. The JOLTS data has been falling for a year. Both the longer run match to hires data as well as specific case of the 2008 recession show a roughly six month lead between JOLTS measures and unemployment. Therefore, I’d anticipate that core unemployment (and eventually headline unemployment) will continue to rise over the next year.
Some other labor market odds and ends follow, but since I no longer have Twitter the best way to keep up with these updates are either subscribing to my substack or following me on bluesky (@newqueuelure).
For reference, here are the latest quits rate DIEM:
The JOLTS job openings data appears to be returning to the post-pandemic shock equilibrium:
Non-seasonally adjusted JOLTS job openings are showing similar pattern — the days of the divergence between the two measures appears to be over:
Initial claims (actually the “claims rate” with FRED’s ICSA divided by CLF16OV and turned into a percentage) is still bouncing around the (hypothetical, estimated) noise floor:
I do get to close out the silly episode of a Harvard economist (Jason Furman) trying to fit noise (i.e. the short drop in the first half of 2022). Too bad I deleted my Twitter account, but for those who have been following over the past year and a half it’s been fun.
Assuming it returns to equilibrium, it would answer Scott Sumner’s “why no mini-recessions” question with “you just haven’t seen them”.
The normal values of the width parameter b translate into a ‘90%’ width of 1.1y to 1.4y, while the shorter duration of the hires shock translates into 0.8y.
Note that the Atlanta Fed tracker is a median (and hourly), while the ECI is essentially an aggregate/average — so there’s a slight normalization difference but the information content (i.e. shock structure) is basically identical.
I had used hires because I was able to track down earlier data for a longer time series that contained more that just one complete recession. It’s this longer run data that I used as the basis for this hires → unemployment “model”.


