Employment situation: core unemployment rising
A couple of fluctuations have vanished, but unemployment without temporary layoffs rises beyond the level triggering a recession detection
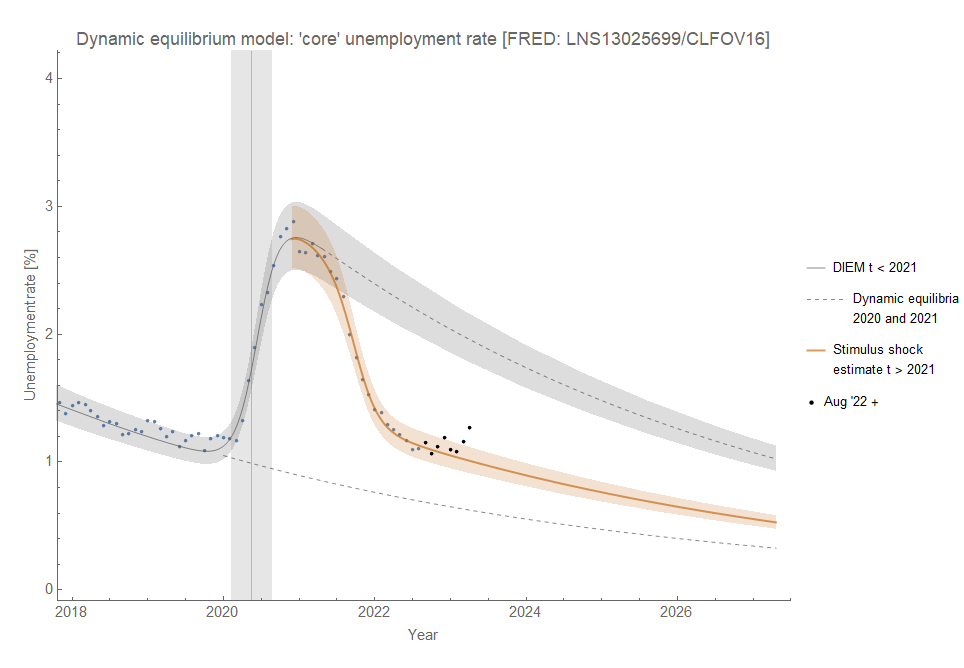
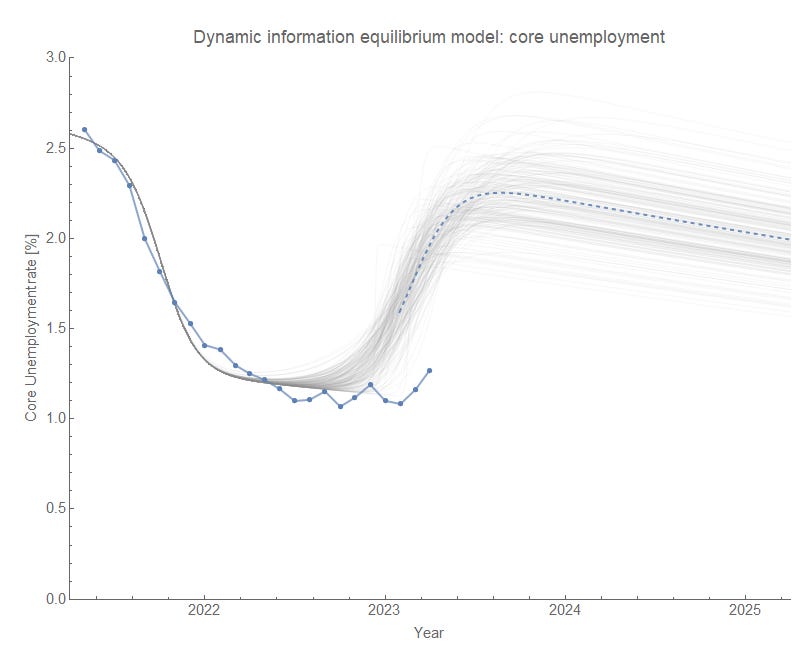
I’ll start with the most consequential data first — looks like the Fed is getting the recession they wanted. Core unemployment is no longer just biased high with a couple points skirting the edge of the band but has risen enough to trigger a recession detection1. Of course, this could be an error in the data, but it would have to be revised down nearly 30 basis points to no longer suggest recession. The past few revisions have been … 3 basis points.
The rise is still not visible in the headline unemployment rate — it remains only biased high.
An alternative source of model error could be a yet undetected “noise floor” in the core unemployment data — i.e. below a certain level, fluctuations are meaningless. This is not wholly implausible as the data is rarely this low:
Given the drops in JOLTS measures, however, we should expect some rise in the unemployment rate. And while it appears to be late we should see a rise from 1% to about 2.5% based on JOLTS hires data:
Speaking of the noise floor, as I mentioned on Twitter yesterday initial claims seemed to have finally risen to a level it is hypothesized to be — implying the series might start giving us useful data. The actual DIEM measure is based on a ratio of initial claims to the civilian labor force — the “claims rate” which can only be updated monthly with the labor force data. However, it too is showing a rise to the edge of the noise floor:
Not so much in the way of new information, but as chief neoliberal shill Matt Darling put it on Twitter: “Not the beginning of the end, not the end of the beginning, but the beginning of being able to statistically measure where we are in the first place.”
Let’s get into the other labor force measures. As I mentioned on Twitter almost a year ago Jason Furman, Harvard economist, appeared to be trying to “explain” noise in the labor force participation rate. Sure enough, he was — the fall in mid-2022 was nothing and this measure kept on trucking (along the dynamic equilibrium, as forecast):
There had also been a fall in women’s employment-population ratio, but the discrepancy between this and the dynamic equilibrium has basically evaporated:
Note that these labor force measures all seem to lag unemployment and JOLTS (JOLTS first, unemployment rate second, participation rate third), so won’t be seeing the impact of falling hires rate or rising unemployment until 6 months to a year later. As such, they’re all following the dynamic equilibrium. The ratio for men didn’t even show the negative deviation that appeared in the women’s measure:
The employment population ratio for people 25-54 did show a slight dip (likely due to measuring both women and men), but has risen back to the dynamic equilibrium path and is currently at the highest level since May of 2001 (beating out January of 2020 by 0.1 percentage point):
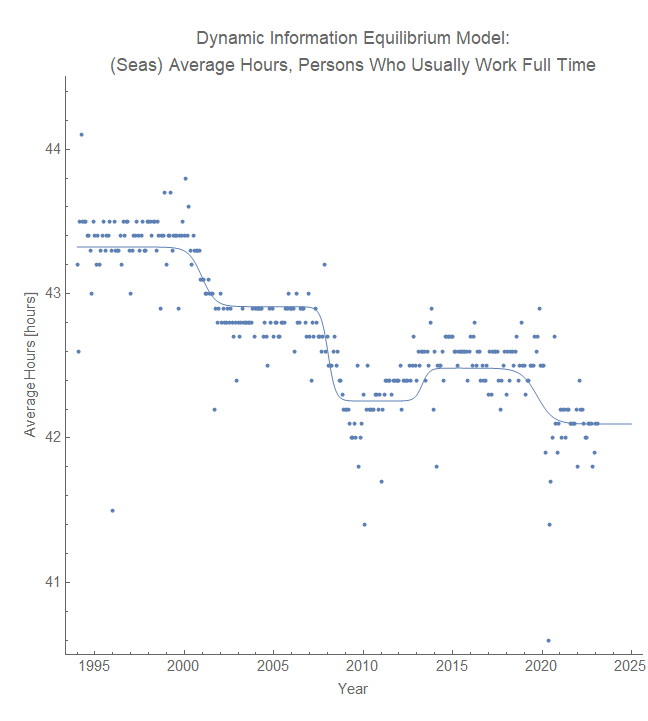
As a side note, I did the same trick I did here using a log-linear transform to show both unemployment and wage growth have the same shock structure as average hours worked:


This indicates that the same general underlying process is likely behind all of the measures. Notably wage growth produced a better model (especially the Obama mini-boom of his second term), but neither of the DIEMs’ recent stimulus shock seems to have propagated to hours worked yet. The lags were 6 months (unemployment) and 16 months (wage growth) — hours worked decline before wages decline or unemployment rises (hours → unemployment → wages). This does not mean causality — there could be some other unmeasured process behind all three. Changes in hours coming 6 months before changes in unemployment means hours are pretty close to JOLTS measures in terms of being a leading indicator2.
Similar to the Sahm rule, but using a constant log(u) instead of a point rise relative to the previous 12 months. However, the Sahm rule is based on the headline U3 unemployment rate which has been abnormal since the mass temporary layoffs during COVID-19 and is still not showing much of an increase. The core unemployment rate (U3 minus temporary layoffs) was not strongly affected by COVID-19 and shows “normal” dynamic information equilibrium model behavior.
Hires changes come on average 5 months before unemployment changes; however as shown above, core unemployment is rising a few months later than expected based on hires.


both headline U3 per vacancy and core U3 (minus temporary layoffs) per vacancy are showing a deviation