Supply, demand, and information transfer
A reference post with an animation showing how information equilibrium operates
I frequently reference this animation I made a few years ago, so thought I should make a reference post with essentially just the animation and explanation. Added footnotes and additional links because I just can’t help myself.
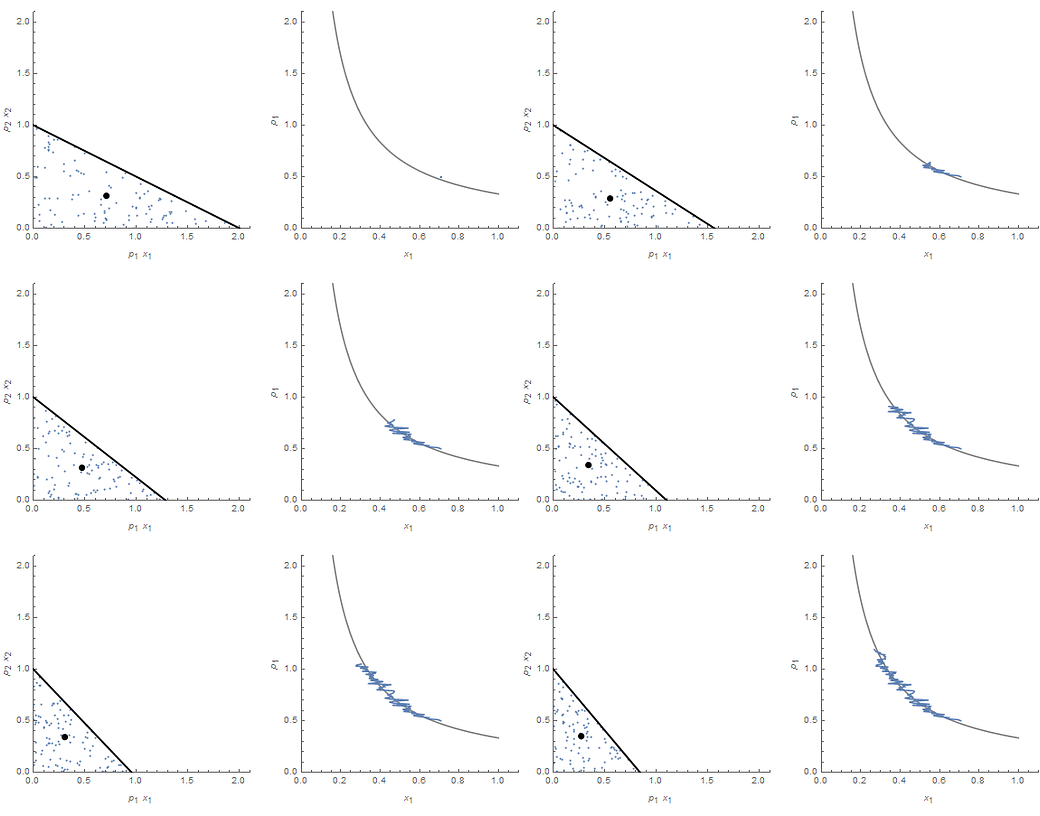
The picture here is derived from Becker (1962) and shows a random cloud of selections from a “state space” (Becker: “opportunity set”) consisting of two goods x₁ and x₂ with prices p₁ and p₂. Changing that state space by moving the budget constraint (i.e. raising the price p₁) traces out a demand curve (less of x₁ is bought).
The connection to information transfer framework is that the agents selecting points of the opportunity set map it out — they “read” the information about demand and “transfer” it to supply. Information “equilibrium” is where the two sides of supply and demand contain the same information1.
If you do not sample the entire opportunity set whether through groupthink, lack of diversity, or simply risk aversion the whole ‘supply and demand thing’ breaks down. There’s no demand curve:
This is called non-ideal information transfer in the framework and it means the information about the demand state space (opportunity set) is being incompletely transferred to the supply state space2. This results in prices falling below their ideal market price (i.e. the action is below the supply and demand curves which are a bound). You can see p₁ falling below the curve in the second animation. This should be thought of in terms of deflation and economic collapse rather than a discount on blueberries.


Curious if you know of this guy and (even if not) what you think about this kind of take on information in your framework? Are we living thru an adaptation to a massive jump in entropy??
https://youtu.be/yhSaPi_zAyY