


Sunspots in the DIEM
A dynamic information equilibrium model of the 11-year solar cycle

First off let me say I am not referring to “sunspots” in the macro model sense. I am referring to actual sunspots — cooler patches on the sun that rise and fall in number over an approximately 11 year cycle. It might be that I’ve built a hammer so everything looks like a nail, but there are a remarkable number of diverse phenomena that can be modeled to greater or lesser degrees using information equilibrium such as the brain vs body mass relationship, COVID-19, transistors (or computing architecture of gates and pins in general), YouTube views1, or determining when avocado toast became a thing.
Since we are nearing / at another solar maximum, I took a look at the sunspot count and noticed there is a pretty good stair-step if you subtract out a log-linear decay:

I used a more Gompertz-like shock model than the usual logistic one which gives a bit more asymmetry. The model in the usual representation of the data works pretty well — we’ll see how well this forecast does:
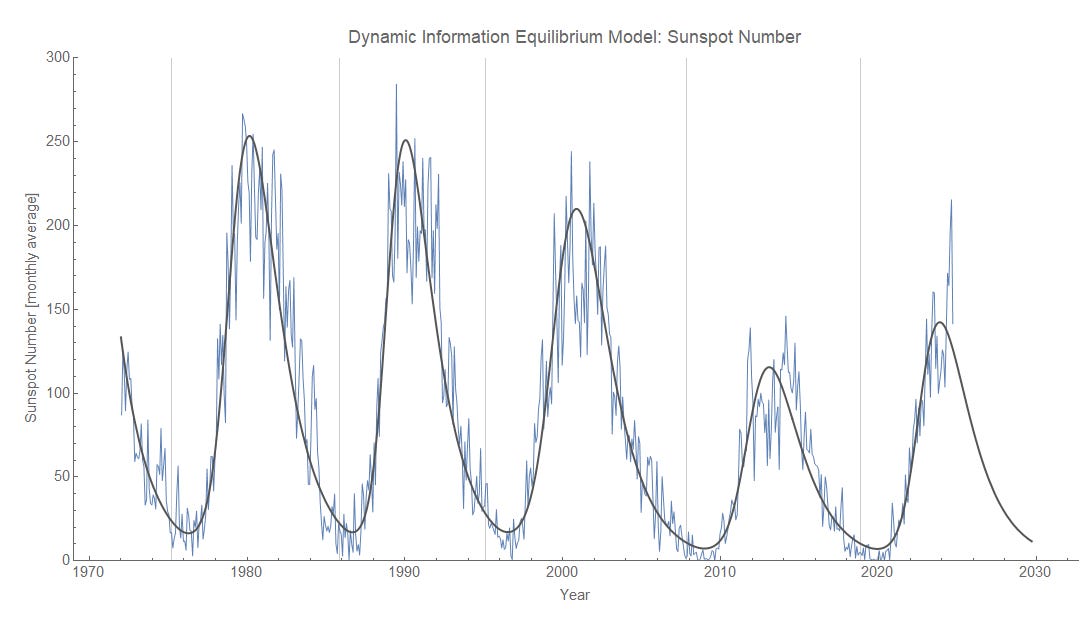
What I am not sure of is the usefulness of the dynamic information equilibrium model (DIEM) for this particular scenario as far as interpretation. Most of the other applications of the DIEM2 have a straightforward interpretation in terms of shocks to a random state space (recession, new COVID variant, a new song) that fades back into equilibrium. There isn’t a “shock” that kicks off a new sunspot cycle — the sun changes its magnetic field polarity at the sunspot peak, not the valley or along the rising edge. Sunspots start to decrease as the sun’s magnetic field untangles itself by “pinching off” field lines resulting in solar flares. As the untangling happens, new tangling begins3 and eventually sunspots start increasing.
At best, the dynamic equilibrium rate (a log rate ~ 0.6/year) gives us some indication of how quickly the solar maximum solar flares untangle the magnetic field. The transition points of the non-equilibrium shocks are where the recently flipped field starts tangling up again — but it’s not a special place in terms of the underlying physics4.
This is therefore more of a fun party trick than a pedagogical exercise. It is pedagogical in the sense that it’s an example where, yes, the math works, but there’s no deeper insight based on the model so it’s probably not what’s actually happening at a fundamental level. These are useful examples! Sometimes things look like waves5 or power laws, but don’t really have the kinds of underlying phenomena that usually produce waves (e.g. restoring forces) or power laws (e.g. scale invariance).
I think I only posted this on the bad place, but here are the YouTube views for “Gangnam Style” vs time:

As opposed to the general Information Equilibrium (IE) model, which is used for the gates (Rent’s rule), transistors, or brain/body mass. Dynamic Information Equilibrium Models (DIEMs) are about rates of growth with shocks whereas IE models work like production functions or supply and demand.
The sun rotates at different speeds at different latitudes which causes magnetic field lines to “wrap around” the sun and become tangled. Where these tangles pierce the surface, they show up as sunspots.
That I am aware of. My astrophysics in grad school was mostly focused on nuclear astrophysics — the reactions inside the sun.
I think there is definitely a common view that looks at e.g. the unemployment rate and sees a nonlinear wave rather than a series of stochastic shocks followed by equilibrium.