


Inflation about where it should be
How is that for an exciting title?

The most recent inflation reports have all been largely consistent with the DIEM1 forecast. In fact, nearly of the monthly reports since the end of 2022 have fallen within the model error2. Plus this model forecast was based on the CPI report from March of 2022 — before the Fed started raising rates.

There is some bias towards higher values, which, per the Monte Carlo (thin gray lines in the graph3) is expected. A positive non-equilibrium shock4 will produce a forecast that is biased upwards relative to the equilibrium so this is not entirely unexpected. Essentially, aside from a spike right at the start of the Russian invasion of Ukraine (with its effects on energy prices), inflation is about where it should be.
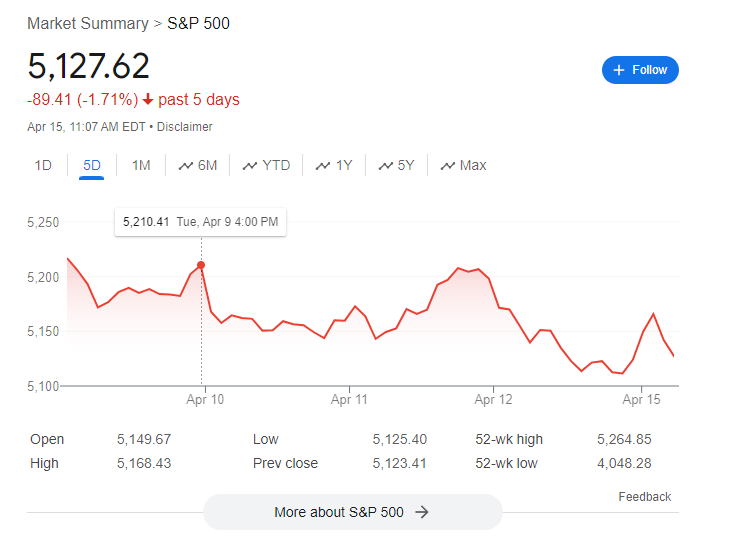
Of course, everyone was expecting something lower in order to usher in a new cycle of Fed rate cuts which have strong effects on stock prices5. You can see the drop from the market close on Tuesday 4/9 to right after the market open on Wednesday 4/10 when the data was released.
There have been no Earth-shattering inflation reports for almost two years — the (welcome) return of boring macro metrics. We should, if the DIEM is accurate and there are no new non-equilibrium shocks, see the upward bias continue to fade out over the next year.
DIEM = Dynamic Information Equilibrium Model. See here. Side note: my paper has been downloaded over 1000 times on SSRN!
The pink band is the RMS error based on model difference from the empirical data from 1947 to 2022 and is approximately one standard deviation and is modeled as symmetric (equally likely to be above or below). This differs from the Monte Carlo (gray lines) — see footnote below.
The Monte Carlo is based on a randomly generated logistic shocks (see footnote below) using the covariance matrix to generate shock parameters. This is how the most likely path (best fit parameters) can fall strongly to one side of the Monte Carlo paths.
