


Three centuries of dynamic equilibria in the UK

If the price level has a dynamic equilibrium (e.g. per the previous post or here), it should be interesting to look at some very long run historical data ‒ specifically this three century time series available for the UK. It turns out that there are two dynamic equilibria. The first hold from the 1600s to the early 1900s is associated with an inflation rate consistent with zero (call it the gold standard equilibrium); the second holding over the post WWII period is the one I've observed before (links at beginning of this paragraph) with an inflation rate of 2.6%:
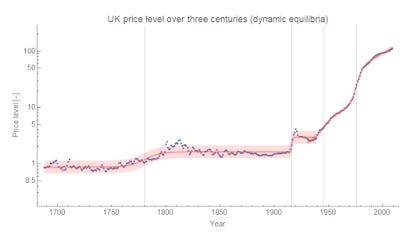
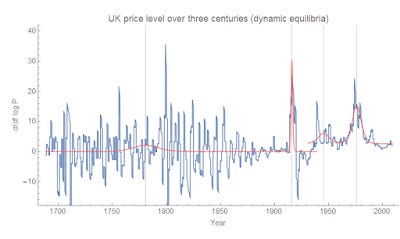
The major shocks are centered at 1780.7, 1916.1, 1945.5, and 1976.1. My intuition is that these are associated with the industrial revolution, WWI, WWII, and women entering the workforce. However, I'm open to alternative theories. If you're looking for a demographic cause of the first shocks, there was a major change in population growth in the early 1800s associated with improved sanitation for example.