


The rest of that NGDP growth vs base growth graph

Scott Sumner shows a graph of year over year NGDP growth alongside a graph of the year over year growth of the monetary base. Here's the rest of that graph:

You can see the change from an approximate 1:1 correspondence to at best a 10:1 correspondence.
This doesn't go through a big change in relative impact 2008:
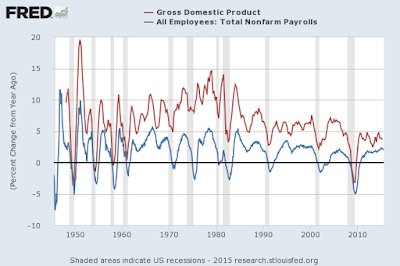
Of course, this is a good model, as opposed to this. Maybe the Fed should target the number of jobs ...