


The long run in the UK, redux

I was asked by an anonymous commenter how the model does over the long run in the UK using the three hundred year-long data set from the Bank of England. I had actually addressed this before, but it was at a time when I hadn't quite figured out the relationships between interest rates and various measures of the money supply.
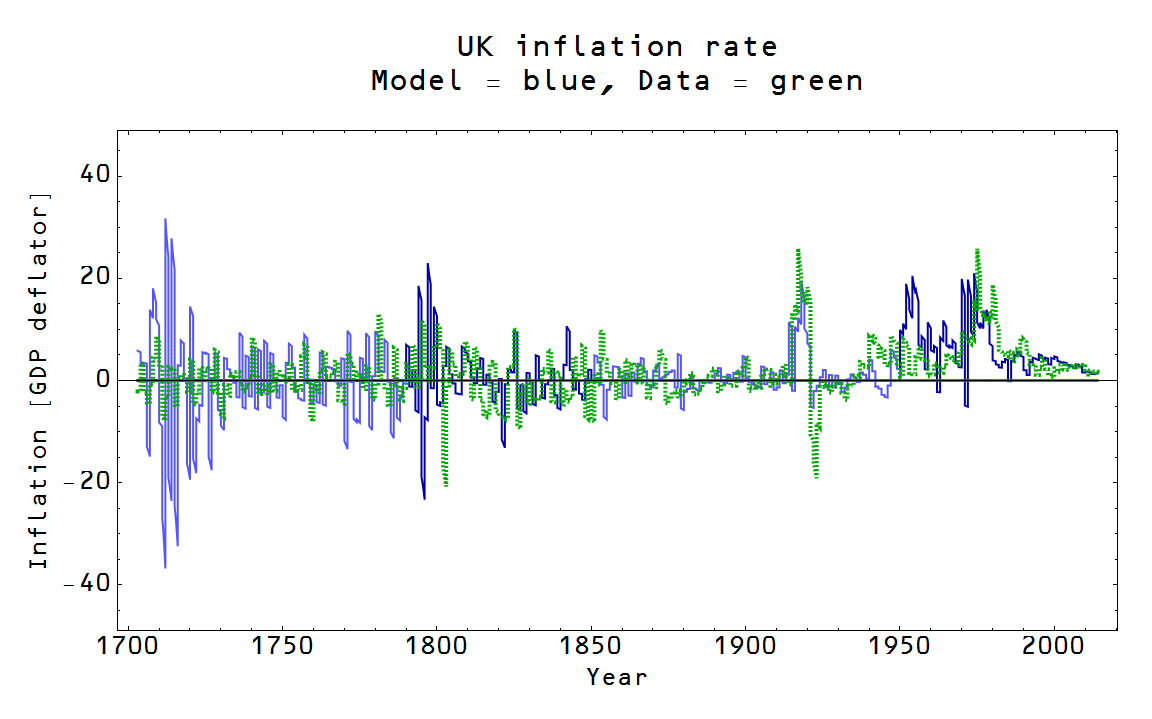
Below are the model fits for the price level (actually, it's the GDP deflator, not CPI) and the long term interest rate. One problem is that I don't know British monetary history well enough to know where to put the monetary regime changes. I chose 1790, 1850 and 1950 because they worked the best; they roughly correspond to the "Restriction Period", the collapse of the railway bubble and Bretton Woods. I plan on doing a more scientific version later (using local fits and looking for the 'phase transitions'). There are some large deviations in the interest rate model that need explanations as well -- I'll discuss those after the graphs ...


In the last graph, there are two significant deviations -- the 1850s to the 1900s and the 1960s to the 1990s. The former roughly corresponds to the period of the so-called Long Depression, which could be the reason interest rates fall below the ideal information transfer model result. The latter deviation could be the result of the Bretton Woods system where the pound was effectively pegged to the dollar, hence effectively importing US interest rates or it could be because the Bank of England held a lot of US dollar denominated debt, importing US rates per this mechanism. Your ideas are welcome, too.
The information transfer model doesn't explain everything! Economies aren't always in equilibrium. However it is a good place to start as you don't know what deviations from equilibrium are until you know what equilibrium is.