


The liquidity trap and the information trap

I am going to explore the relationship between liquidity traps (LT) and what I called information traps (IT) which manifest similar phenomena. The original meaning of the liquidity trap is a horizontal demand curve for money at some interest rate. In Keynes' work, it was possible for this to happen at any interest rate, however later work purported that this could only happen at the zero lower bound (interest rate r ≈ 0). As there has been no evidence for an economy experiencing a liquidity trap at r > 0 (even during the Depression, rates were near zero), the economic consensus is that the liquidity trap and the zero lower bound problem (ZLB) are one in the same. It turns out Keynes' original formulation is more accurate in the information transfer framework; LTs can happen at any interest rate -- it's just that past experience makes us think LT and ZLB are the same.
In the information transfer framework, the key indication of an information trap is an information transfer index, which determines how much effect the unit of account has in the economy, is closer to 1 than to 0.5 (in the latter case, the information transfer model of the market P:NGDP→MB with the unit of account effect and the quantity theory of money are the same thing). In the liquidity trap (IS/LM) model, the key indicator is the interest rate. In this graph, I've plotted the Fed Funds rate (green, left axis) and the information transfer model of the rate (blue, left axis) alongside the information transfer index (red, right axis):

It is immediately obvious that the relationship is not immediately obvious. The index rises monotonically while the rates rise and fall. I decided to go back to the 3D picture of the price level surface (where the information trap criterion appears as a ridge on the surface) and plot the equivalent interest rate surface. Here is that graph with the interest rate surface in red and the price level surface in white (constant values i.e. level curves of the z-coordinate are shown with lines on the surfaces the units of the z-axis are log interest rate r and log price level P, but the relative magnitudes don't matter):

I've drawn the ridge line (information trap criteria) as a dashed curve on the price level surface. Everything with a larger monetary base than this curve is in an information trap -- the derivative of the price level with respect to the monetary base is zero or negative meaning the central bank can't create inflation with monetary policy. You can see that the projection of the dashed curve onto the red interest rate plane results in a non-trivial relationship. You can see it more clearly if you look at the interest rate plane itself:
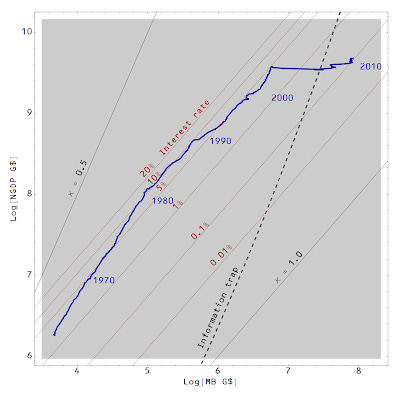
The level curves of the red surface (constant interest rate) are plotted in red, two lines of constant information transfer index are plotted in black along with the information trap criterion (dashed). The modeled path of the US economy (from the graph at the top of this post) in the space is plotted in dark blue with a few years indicated. You can see that the relative size of the monetary base that leads to an information trap gets smaller as the economy (NGDP) grows (for a larger NGDP, a larger MB is necessary to be in an information trap but MB/NGDP decreases).
According to the information transfer model, interest rates are always "low" when you're in an information trap, but "low" is a relative term. From the 1960s until the present, you had to have interest rates below 1% to be in an information trap. In the 1970s the rate had to be below ~ 0.01%. Starting in the 1990s, an interest rate below 0.1% became sufficient (the current August 2013 effective Fed funds rate is 0.08%). The information trap rate will reach 1% when NGDP reaches about 22 trillion dollars.
Note that the validity of the interest rate model may not reach such low interest rates, so at best we can say is that the information trap interest rate has been r ≈ 0 and will not become large for quite some time. Therefore, ZLB ≈ LT ≈ IT for now but it is theoretically possible for LT ≈ IT above the zero lower bound representing a flat money demand curve at non-zero interest rate as Keynes' originally formulated it.
PS An upcoming post will reproduce this graph in the case of Japan.