


The economy of the United Kingdom

I thought I'd try a couple of models out on the UK economy.
I. Dynamic equilibrium and employment
First, the dynamic equilibrium unemployment rate model. This turned out reasonably well, but I am confused by a few shocks where I cannot identify a source. Here is the resulting fit:


The transitions (shocks) are at 1975.3, 1981.2, 1988.8, 1991.4, 1997.3, 2005.9, 2009.0, 2011.4, 2014.3. Most of these line up with shocks to the US or EU (labeled), representing either global recessions, or in the case of 2011.4 the ECB raising interest rates. However this leaves four shocks that are unaccounted for labeled A (1988.8), B (1997.3), C (2005.9), and D (2014.3).
The shock labeled C is the most uncertain, and might correspond to a delayed reaction to the early 2000s stock market bust. It could be left out and chalked up to measurement error or random fluctuations.
The shocks A, B, and D are all positive shocks to the UK economy, reducing unemployment. Shock D corresponds to the positive shock in the US associated with the ACA (2014.4). It is not impossible that the subsequent "boom" in the US economy boosted the UK economy but that seems a bit far fetched. Possibly there was some global boom that impacted both the US and UK. Shock A does correspond with a massive spike in RGDP growth (see below). Shock D corresponds to RGDP growth that is high as well ‒ at least high relative to the post-financial crisis norm. If anyone out there has some theories as to what could be happening, let me know in comments.
II. Quantity theory of labor and capital
I don't think I went through the "quantity theory of labor and capital" for the UK before. The model is basically a modification of the Solow model and gives us functions NGDP = NGDP(L, K) and CPI = CPI(L, K) = dNGDP(L, K)/dL. Here are the 4-parameter (+ 1 normalization factor that drops out of the rates shown below) fits to the data:
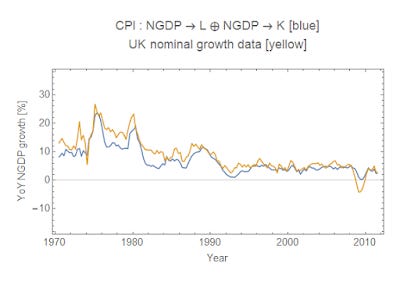

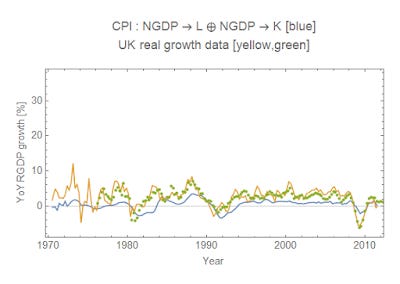
I show year-over-year growth rates in order to cut down the seasonal noise. The NGDP growth is a bit low and CPI inflation is a bit high meaning the CPI-deflated RGDP model (blue in the third graph) is significantly below the CPI-deflated RGDP data (yellow). The year of year change of the RGDP data reported in FRED is shown in green. Not bad for almost 50 years of data for two (independent) time series and 4 parameters.
III. The two together
Additionally, we can see the rough correspondence between the RGDP growth rate (green data from above) and the employment shocks from the dynamic equilibrium model in the graph below. This isn't necessarily groundbreaking research as it is basically a confirmation of Okun's law.

We end up with a fairly simple information equilibrium model that captures most of the empirical data that has 5 parameters:
CPI : NGDP ⇄ L
NGDP ⇄ K
U ⇄ CLF
where U is the total unemployed, CLF is the civilian labor force, L is the number of people employed, and K is the nominal capital stock (from here). The five parameters are the IT indices of the three relationships (α, β, and k, respectively with the former two being the Solow exponents) along with two normalization factors (L₀, K₀).