


The driving equilibrium

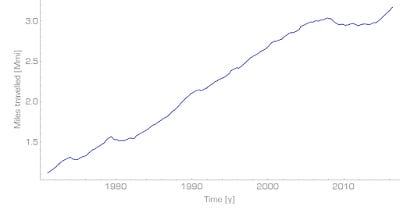
FRED has updated the data on the number of vehicle miles driven, and it looked to me like a perfect candidate for a "growth equilibrium state" analysis using minimum entropy like I did for unemployment (see that post for more details about the process). Here is the original data:
The growth rate bins (note this is not a log-linear graph, so these are not exponential growth rates, but rather linear growth rates) look something like this:

The slope that minimizes the entropy is about α = 0.062 Mmi/y ("dr" is the data list and "DR" is an interpolating function of the data list):

And here is the minimized entropy distribution (i.e. the "spikiest" distribution):

Subtracting that trend and fitting a series of logistic functions (Fermi-Dirac distributions) to the data gives a pretty good fit:

The center of the transitions are at 1974.4, 1980.3, and 2009.5 -- corresponding to the three longest recessions between 1971 and 2016. This results in a pretty good "model" of the number of vehicle miles traveled:
