


Successfully forecast over 1½ years of S&P 500 data

I haven't compared my S&P 500 forecast to data in a few months (last time in early June). The original forecast was made back in January 2017, and the two years will be complete come January 2019. The post-forecast data is shown in black:
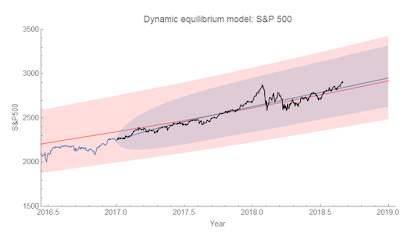
The pink band represents the model error, while the blue band (overlaid with pink making it purple) represents an AR process — specifically an ARMA(2,1) process — forecast from the last data point (i.e. taking into account the random component, as discussed in a footnote here). The increase in volatility since the corporate tax cut is definitely visible in the data. There was a poster about volatility regimes presented by Tobias Sichert at ASSA 2018 which is relevant (discussed here), and possibly foreshadowing a future recession ...
Here's the data over the longer term, putting the forecast in context:
