Stocks and k-states, part IV
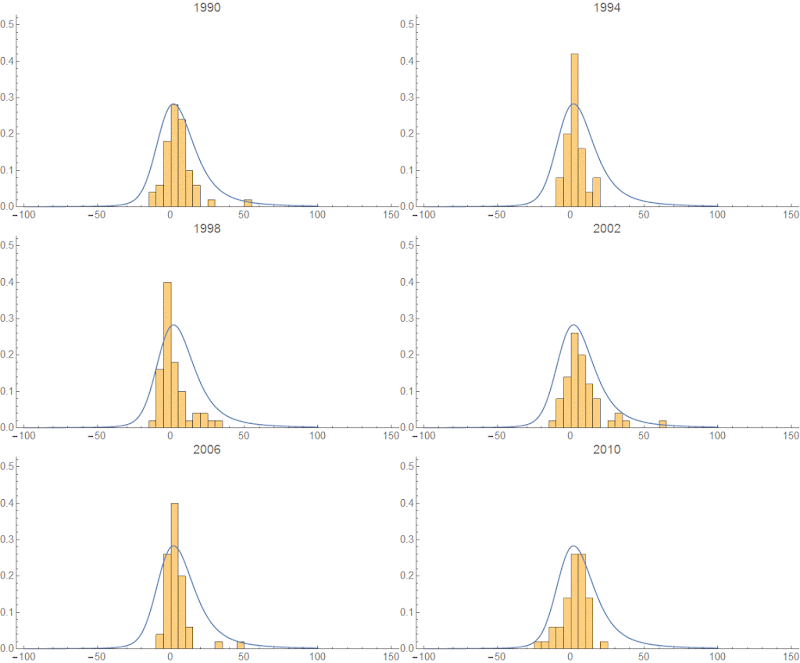
I re-ran the analysis presented here (using a different random sample of 50 companies from the NYSE) for a longer period 1990-2010 and the distribution of stock market "k-states" (see previous link) is much more stable than the cumulative returns ‒ more evidence for the "statistical equilibrium" of k-states.
Here are the k-states:

Except for the Great Recession (2088-2009), the distribution is stable. And here are the cumulative returns alone:

In both figures, the blue distribution is more intended to guide the eye than a particular measure ‒ I eyeballed the parameters of a stable distribution to look a bit like the k-state distribution and scaled the parameters for the cumulative return space to give an "equivalent" distribution over the different domain.


