


Reconciling expectation and information

There was a brief back and forth between Scott Sumner and me in comments on his post on whether money is tighter or looser given a drop in interest rates. Sumner said (the edited version):
The fed funds change is different. Whereas a change in IOR affected the demand for base money, a change in the few funds rate is an effect of a change in the supply of base money. That’s easier money in the short run, ceteris paribus. But whether it is actually easier money depends on how the action impacts the expected future path of monetary policy.
The short run effect is the liquidity effect, which I describe in more detail at this link. I commented that the long run effect was the same result as I gave in this post, except the "depends" clause was different -- in the information transfer (IT) model result the depending is measured by the size of the base relative to the size of the economy (e.g. NGDP). Sumner disagreed with it initially, but then agreed with my contention that if the base is small, the future path of monetary policy is likely expansionary (i.e. looser money, leading to higher interest rates). I'd like to say more about that with this post.
But first, I have to correct some sloppy language on my part. I have a tendency to say "the size of the base relative to NGDP" or write "MB/NGDP" when I actually mean a) not MB but M0, the currency component of the base (i.e. without reserves) and b) not the ratio but the ratio of the logarithms log M0/log NGDP (aka the IT index, denoted by the Greek letter kappa κ elsewhere in this blog). You can see what I mean when I plot the two ratios here:

We can see that κ goes from a smaller value in the 1960s to a larger value today, whereas the simple ratio goes down and then up (it is normalized to 2011). The IT index κ is more relevant in the model because the price level is determined by the base via log P ~ (1/κ - 1) log M0 which means that P ~ constant for κ = 1. Another way to look at the IT index is that it is the fraction of a unit of source information that can be transferred with the unit of account, i.e. 1/logM0 NGDP = log M0/log NGDP (using my poor man's subscripting technique to represent the logarithm in base M0) analogous to Sumner's share of the economy that can be bought with one dollar (value of money = 1/NGDP).
Now how do we reconcile the expectation of future base growth ("loose money") with the size of the base M0? Well, if we plot the numerator (blue) and denominator (red) of the IT index and assume a uniform probability distribution (maximum ignorance) using the denominator (log NGDP, i.e. where κ = 1 if log M0 = log NGDP) as the upper bound and the quantity theory of money (κ = 1/2) [1] as the lower bound (dashed gray) for the possible values of log M0, we can see that if the IT index is below κ = 3/4, more states in log M0 space exist above than below the current value of the base in 1970. See the relative length of the green line segments the diagram below:
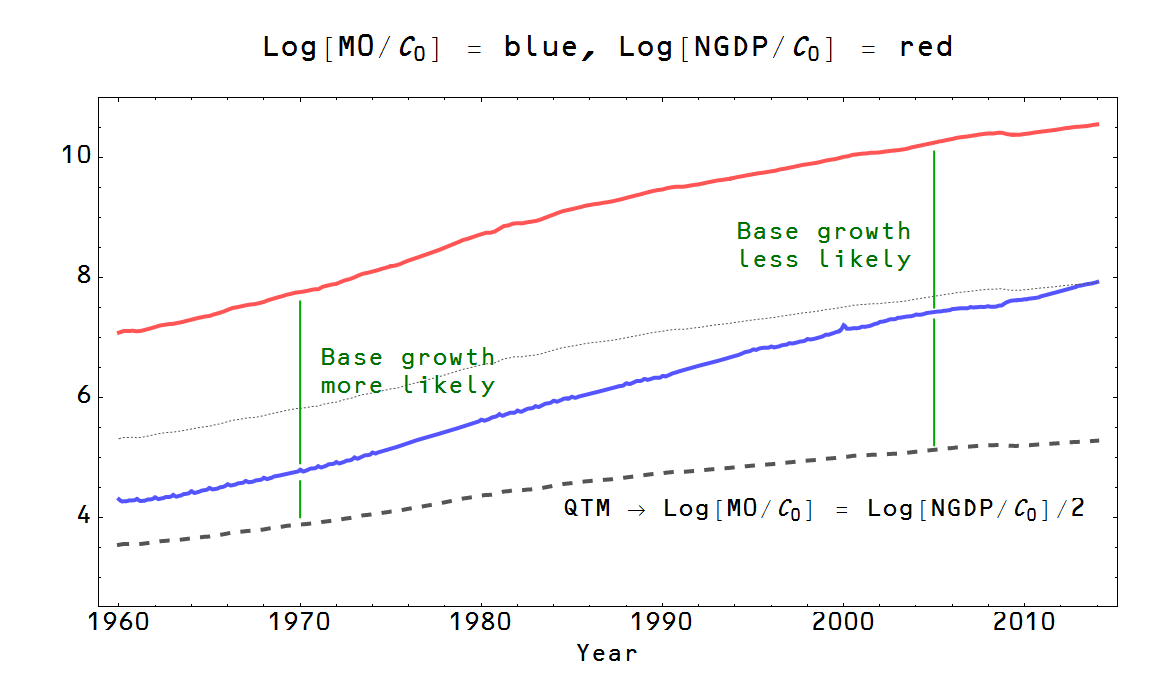
We can put this in Sumner's language in the quote above. In 1970, there are more places for log M0 to be above its current value than below, meaning a larger base and therefore looser money is expected. That means interest rates will tend to rise as an effect of base expansion. In 2005, a larger or smaller base are closer to being equally likely (i.e. that base expansion is less likely than it was before in the 1970s), meaning that interest rates will tend to stay constant or fall as an effect of base expansion.
The uniform distribution over the values of κ ∈ [1/2, 1], of course, is an oversimplified picture. The actual probability distribution over the possible expected values would likely involve more understanding of human behavior (in response to Mike Freimuth's comments here) -- the distribution is probably peaked at the value of the (log of) the base and goes to zero at (the log of) NGDP as well as zero (log 0 = -∞), but its exact form would depend on how humans discount rare events (see e.g. prospect theory).
The actual cross-over point, based on the behavior of IS curves (i.e. the effect of expansionary policy on interest rates), seems to be in the late 1970s or early 1980s. This is where the IS curves turn over and loose money means lower interest rates.
[1] If we have log P ~ (1/κ - 1) log M0 then κ = 1/2 means that (1/(1/2) - 1) log M0 = (2 - 1) log M0 = log M0 = log P, i.e. P ~ M0 (the quantity theory of money) and the rate of growth of the price level is equal to the rate of growth of the base. [Added in update 6/14/2014]