Random correlation of the day

I noticed a random correlation today:

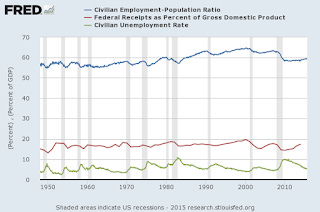
The employment-population ratio and Federal tax (and tariff, etc) receipts to NGDP. With the exception of the structural shift in the emp-pop ratio due to women breaking into the workforce, this is pretty remarkable. There are plenty of logical explanations (e.g. taxes proportional to employed, GDP proportional to population), but is there really a good reason for the relative size of the government to be the same over the course of 60 years? There were lots of Democrats on the front half end and lots of Republicans on the back half. Neither had any impact; bupkis.
Also, the emp-pop ratio is considered by the information transfer model to be effectively constant. With the Federal revenues being even more stable (it lacks the structural shift), a fortiori, the relative size of the government sector is constant. It joins the ratio of nominal wages to nominal GDP as some of the most constant things in macroeconomics.
That is to say if you can't explain the price level over the past 60 years, what hope does your theory have for something that changes by an order of magnitude less!
PS The unemployment rate is only slightly less stable: