


Principal component analysis of jobs data

Narayana Kocherlakota tweeted about employment making a random claim about the "steady state" employment growth that seems to come from nowhere which inspired me to do something I've been meaning to do for awhile: a principal component analysis of the Job Openings and Labor Turnover time series data ('JOLTS'):
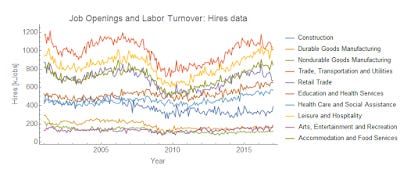
I used a pretty basic Karhunen–Loève decomposition (Mathematica function here) on several seasonally adjusted hires time series from FRED (e.g. here). For those interested (apparently no one, but alas I'll do it anyway) the source code can be found in the Dynamic Equilibrium GitHub repository I set up. Here's the result (after normalizing the data):

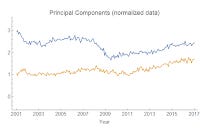
The major components are the blue and yellow one (the rest are mostly noise, constant over time). I called these two components the "cyclical" (blue) and the "growth/decline" (yellow) for fairly obvious reasons (the growth/decline is strongest after 2011). It's growth or decline because the component can be added with a positive (growth) or negative (decline) coefficient. Here are how those two components match up with the original basis:

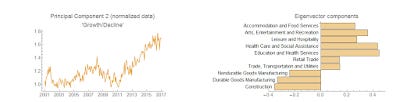
The story these components tell is consistent with the common narrative and some conventional wisdom:
Health care and education are not very cyclical
Health care and education are growing
Manufacturing and construction are declining
Here's health care on its own (which looks pretty much like the growth/decline component):

And here's manufacturing (durable goods):

To get back to Kocherlakota's claim, the "steady state" of jobs growth then might seem to depend on the exact mix of industries (because some are growing and some are declining) and where you are in the business cycle. However, as I showed back in January, total hires can be described by constant relative growth compared to the unemployment level and the number of vacancies ‒ except during a recession. This is all to say: it's complicated [1].
PS Here are all of the components (here's a link to my Google Drive which shows a higher quality picture):

...
Update 16 March 2017
I added government hiring, normalized data to the mean, and standardized the output of the algorithm. The results don't change, but it looks a bit better:


Here are the two main vectors (standardizing flipped the sign of the growth/decline vector):


And here's the original data, updated with the new data points released today (I subtracted the census peak by interpolating between the two adjacent entries):

...
Footnotes:
[1] Although I'm still not sure where the 1.2 million jobs per year comes from; here's the employment change year over year:

The bottom line is Kocherlakota's 1.2 million figure. The second from the bottom is the 1.48 million rate that comes from averaging the growth rate including recessions (it's almost 1.6 million for just post 1960 data). The upper line is my "guesstimate" for the average excluding recessions (2.5 million). Maybe it was a typo and he meant 2.2 million.