


Price growth (i.e. inflation) state distribution

I have started looking at some price data from Cavallo 2016 (related to MIT's billion price project) in order to make a better version of the graph at the bottom of this post: an animation of the distribution of CPI changes among the components of CPI. Effectively, I want to try and visualize the equilibrium price change distribution (the price state space) of individual prices. This is also some relevant background reading (hitting on zero price changes) -- I claim that although individual prices are not "sticky", there is an equilibrium distribution (a statistical equilibrium per Gregor Semieniuk).
Unfortunately, the files are really huge and my six year old desktop is choking on them; I'm in the process of finding a workaround. I managed to look at part of the data (it is price data from supermarkets from 05/2008 to 07/2010) and it largely shows a stable bimodal distribution (i.e. unchanging, not the specific distribution called a "stable distribution") of non-zero price changes.

In talking about "equilibrium" (e.g. here), we can think of the these price changes existing in an equilibrium distribution of price changes while individual prices are changing (similar to atoms being in an equilibrium velocity distribution even though each atom is changing its speed with every collision).
If you've looked at the animation, you might have noticed a big change in April of 2010. I am not sure if that is an artifact of the way that I grabbed the data (effectively the first million entries in a CSV file) or a real event where over 60% of prices went up by about 10%. The major world events include a downgrade in the course of the Greek debt crisis and the Deepwater Horizon oil spill, but these come near the end of the month. Does anyone else know of an event in April of 2010 that would affect supermarket prices that could do this to the distribution:
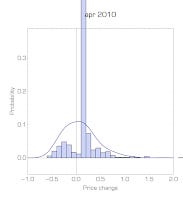

It is possible that since I only have part of the data, it could be that the data I am looking at consists of just one store that decided to raise their prices by 10%. Anyway, I'm still investigating. Besides this single month of data, this seems to be a qualitative success of the "statistical equilibrium" approach.