Metzler diagrams from information equilibrium

Paul Krugman has a post today where he organizes some DSGE model results in a simplified Mundell-Fleming model represented as a Metzler diagram. Let me show you how this can be represented as an information equilibrium (IE) model.
We have interest rates $r_{1}, r_{2}$ in two countries coupled through an exchange rate $e$. Define the interest rate $r_{i}$ to be in information equilibrium with the price of money $M_{i}$ in the respective country (with money demand $D_{i}$) -- this sets up four IE relationships:
$$
\begin{align}
r_{1}& \rightleftarrows p_{1}\\
p_{1} : D_{1}& \rightleftarrows M_{1}\\
r_{2}& \rightleftarrows p_{2}\\
p_{2} : D_{2}& \rightleftarrows M_{2}
\end{align}
$$
This leads to the formulas (see the paper)
$$
\text{(1) }\; r_{i} = \left( k_{i} \frac{D_{i}}{M_{i}}\right)^{c_{i}}
$$
Additionally, exchange rates are basically given as a ratio of the price of money in one country to another:
$$
e \equiv \frac{p_{1}}{p_{2}} = \alpha \frac{M_{1}^{k_{1}-1}}{M_{2}^{k_{2}-1}}
$$
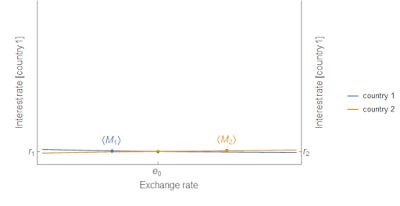
And now we can plot the formula (1) versus $M_{1}^{k_{1}-1}$ (blue) and $M_{2}^{1-k_{2}}$ (yellow) at constant $D_{i}$ (partial equilibrium: assuming demand changes slowly compared to moneytary policy changes). This gives us the Metzler diagram from Krugman's post and everything that goes along with it:

Also, for $k \approx 1$ (liquidity trap conditions), these curves flatten out: