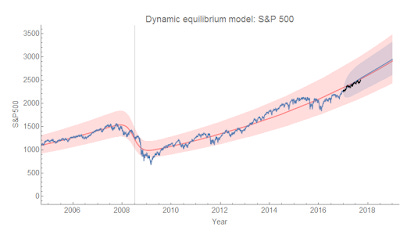
Marking my S&P 500 forecast to market

Here's an update on how the S&P 500 forecast is doing (progressively zooming out in time):

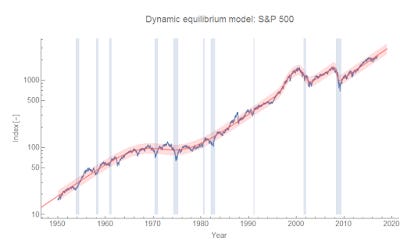
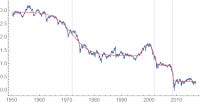
Before people say that I'm just validating a log-linear forecast, it helps to understand that the dynamic equilibrium model says not just that in the absence of shocks the path of a "price" will be log-linear, but will also have the same log-linear slope before and after those shocks. A general log-linear stochastic projection will have two parameters (a slope and a level) [1], the dynamic equilibrium model has one. This is the same as saying the data will have a characteristic "stair-step" appearance [2] after a log-linear transformation (taking the log and subtracting a line of constant slope).
Footnotes:
[1] An ARIMA model will also have a scale that defines the rate of approach to that log-linear projection. More complex versions will also have scales that define the fluctuations.
[2] For the S&P 500, it looks like this (steps go up or down, and in fact exhibit a bit of self-similarity at different scales):