


It's people. The economy is made out of people.

The question of what exactly economic growth is, and how it works, has been around for awhile. It continues to this day -- for example in Paul Krugman's review from today of Robert Gordon's The Rise and Fall of American Growth, we have a technology story:
Gordon [declares] that the kind of rapid economic growth we still consider our due, and expect to continue forever, was in fact a one-time-only event. First came the Great Inventions, almost all dating from the late 19th century. Then came refinement and exploitation of those inventions — a process that took time, and exerted its peak effect on economic growth between 1920 and 1970.
This is part of a technology advancement view of economic growth that's been around since the dawn of modern economics (after the theories of "having all the gold" and "having all the productive land" went nowhere). Today the largest component of economic growth is captured in a measure called total factor productivity often attributed to "technology". Real business cycle theory even attributed the business cycle to "technology shocks".
One probable reason for this theory's persistence is that economic growth itself (at least as we view it today) seems to start in the 1700s with the industrial revolution. Interestingly, this is also when central banks got their start ... along with various quantity theories of money (as opposed to the "quantity theories of technology" above).
Last Friday, I put together a simple, yet empirically effective model of inflation that were the beginnings of what could be called a "quantity theory of labor". I'd like to put forward the idea that maybe economic growth in the long run has nothing to do with money or technology. Instead it is all about information equilibrium (see my paper) between nominal output and the labor force.
Let's start with the information equilibrium relationship
CPI : NGDP ⇄ CLF
where CPI is core CPI, NGDP is nominal output and CLF is the civilian labor force. In information equilibrium, we can solve the information equilibrium differential equation (which the previous notation stands for) in general equilibrium to obtain:
NGDP = n (CLF/c)ᵏ
CPI = (n/c) k (CLF/c)ᵏ⁻¹
with n and c being constants and k being the information transfer index. How well does this work empirically? Very well -- for such a simple model. I show nominal output, nominal growth and the inflation rate:
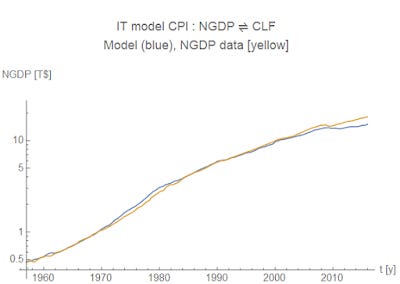


The yellow curves are data and the blue curves are the model above. I fit the parameters to both equations simultaneously, resulting in an IT index k ≈ 4.0. One way to interpret this geometrically is that if the CLF is the radius of a 4-sphere, NGDP is proportional to its 4-volume and CPI is proportional to the 3-volume of its surface.
How do we get business cycle fluctuations in this model?
One way would be with a "sunspot" model, potentially with the central bank acting as Roger Farmer's Mr. W (the coordinating source of "sunspots") in his paper [pdf] Global Sunspots and Asset Prices in a Monetary Economy:
What coordinates beliefs on a sunspot equilibrium? Suppose that Mr. A and Mr. B believe the writing of an influential financial journalist, Mr. W. Mr. W writes a weekly column for the fictitious Lombard Street Journal and his writing is known to be an uncannily accurate prediction of asset prices. Mr. W only ever writes two types of article; one of them, his optimistic piece, has historically been associated with a 10% increase in the price of trees. His second, pessimistic piece, is always associated with a 10% fall in the price of trees.
Mr. A and Mr. B are both aware that Mr. W makes accurate predictions and, wishing to insure against wealth fluctuations, they use the articles of Mr. W to write a contract. In the event that Mr. W writes an optimistic piece, Mr. A agrees, in advance, that he will transfer wealth to Mr. B. In the event that Mr. W writes a pessimistic piece, the transfer is in the other direction. These contracts have the effect of ensuring that Mr. W’s predictions are self-fulfilling.
In the model in this post, the Fed would occasionally give pessimistic forecasts, leading to downturns. However I'd propose a more agnostic view of spontaneous coordination in open markets leading to non-ideal information transfer. If information transfer is non-ideal, we can only put bounds on the macro variables:
NGDP > n (CLF/c)ᵏ
CPI < (n/c) k (CLF/c)ᵏ⁻¹
We'd have a fall in CLF from non-ideal information transfer, which would lead to a fall in nominal output. This leads to a temporary shock to the price level. Here's an animation (I plan on updating this later [update: updated] to show it in the presence of economic growth) where D (aggregate demand) represents NGDP and S represents CLF (labor supply):
There are some pretty wild implications of this model. It means the Fed has little control of the economy (except to potentially crash it). It means monetary theories aren't necessarily causal in the traditional sense. They could have something to do with non-ideal information transfer -- the mechanism of market failure -- but during "normal times" monetary policy is irrelevant. It means "Keynesian" theories work inasmuch as they increase the size of the labor force; other mechanisms of fiscal stimulus (e.g. via inflation) are irrelevant. It's also interesting that even people without jobs but still considered "in the labor force" are important. And if this were a Solow model, we'd have labor with an exponent of 4 and capital with an exponent of 0 (and increasing returns to scale).
It also means Gordon's story of technological innovation above is irrelevant except through ways that technology allow more people to be a part of the labor force. But the biggest factors impacting the labor force in the time period Gordon references was the entry of women and African Americans -- social and political factors, not technological. The economic boom associated with the industrial revolution would have been about people leaving subsistence farming for industrial labor force. A similar story probably applies to China.
It's true this is an incredibly simplistic view of an economy -- it's made out of people. But maybe we should take something incredibly simple like this to be a starting point for macroeconomic study?
...
PS This doesn't mean income/nominal output is allocated proportionally to each member of the labor force. In fact, it would probably have some kind of maximum entropy distribution with a constrained value of < log w > where w is income -- a Pareto distribution -- unless government redistributive policies intervened.
...
Update 27 January 2016
I was asked for a graph of (CPI deflated) RGDP growth using this model. I have provided both a comparison with NGDP/CPI as well as the RGDP growth data directly from FRED (deflated via the GDP deflator). Neither seem to do very well -- the issue is essentially the compounding of model and measurement error from the CPI data and the NGDP data. The average RGDP growth rate from the model is systematically low. The fit objective function above was chosen to minimize the difference between the models and the NGDP and CPI level data, and a different objective function could be chosen to optimize all three level measures, or optimize all three rate measures.

