


Information equilibrium and time series

I have been dealing with time series for quite awhile now, but I thought I'd formalize a couple of properties. First, let's rewrite the information equilibrium condition. If $A = A(t)$ and $B = B(t)$, then
$$
\frac{dA}{A} = k \frac{dB}{B}
$$
becomes
$$
\frac{1}{A}\; \frac{\partial A}{\partial t} dt = k \frac{1}{B}\; \frac{\partial B}{\partial t} dt
$$
$$
\frac{\partial \log A}{\partial t} = k \frac{\partial \log B}{\partial t}
$$
This simplifies for two relevant classes of functions: waves and exponential growth.
Waves
For waves, we have (if $A(t) = A_{0} \exp i \omega_{A} t$ and $B$ is analogous):
$$
\omega_{A} = k \omega_{B}
$$
and the abstract price $P \equiv dA/dB = k A/B$ is
$$
P = k\frac{A_{0}}{B_{0}} \exp i \left(\omega_{A} - \omega_{B} \right)t =k \frac{A_{0}}{B_{0}} \exp i (k - 1)\omega_{B}t
$$
Here is a graph of an example:

Here's another with changing frequencies:

Exponential growth
For an exponential growth system, we have (if $A(t) = A_{0} \exp \gamma_{A} t$ and $B$ is analogous)
$$
\gamma_{A} = k \gamma_{B}
$$
Basically, the growth rates are proportional to each other. The abstract price $P \equiv dA/dB = k A/B$ is
$$
P = k\frac{A_{0}}{ B_{0}} \exp \left(\gamma_{A} - \gamma_{B} \right)t = k\frac{A_{0}}{B_{0}} \exp (k - 1)\gamma_{B}t
$$
Here is a graph of an example:

Or in terms of growth rates:

As I said above, the growth rates are proportional to each other. However, the idea that growth rates are proportional to each other is really only useful if the growth rates change. For example:


And it's even better to see this with real data (the quantity theory of labor model):

PS The growth rate graphs should say growth rate on the y-axis, but I'm too lazy to change them right now.
...
Update + 2 hours
I figured I'd eventually get the question: what happens if you combine waves and growth. However in thinking about it, I came the the realization that the waves picture might not be useful for economics (it could be useful for communication theory). That's because if you have a damped oscillator, you'd actually have to have the economy completely collapsing and going negative. This doesn't really make a lot of sense.
What you really have in macroeconomics is fluctuations in growth rates, not some growth rate plus a oscillating component.
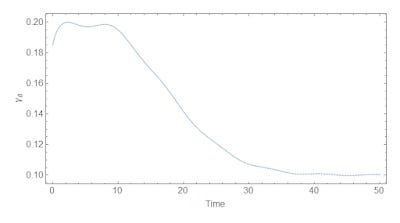
I did put together a picture to illustrate this, and found something interesting. Here is the growth rate $\gamma_{B}$ -- it falls but does not go to zero and there are some oscillations:
And here are the (continuously compounded) growth rates of the three components ($A, B, P$):
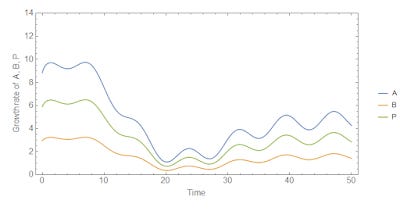
I was interested in the shape of the second set of curves -- they appear to fall and then rise again. The source growth rate $\gamma_{B}$, however, just sort of smoothly falls towards its steady state. Since this was supposed to be a cartoon/toy model of the US economy (see above), it made me thinking that it was possible our current low growth and inflation rates might rebound like this -- that current low growth was just such a point.
Maybe that is why Japan has hints of a rebound?
I could have also made some kind of calculation error. Consider this highly speculative.