


Implausible plausibility

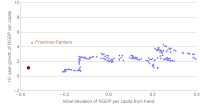
Likely in response to Paul Krugman's post titled "Plausibility", JW Mason put out his own post titled "Plausibility". However, the data shown is from 1925 to 2005 -- and includes the Great Depression and the mobilization for WWII:

Without those periods, the Friedman/Sanders point is well outside the mean (it is a 4.0-sigma deviation along the x-axis and a 2.8-sigma deviation along the y-axis) -- which was exactly Krugman's point:

...
Update
JW Mason has updated his post with regard to this objection -- and thinks a WWII level of mobilization is possible. He now adds a linear fit ... but that fit likely leaves out some of the data (marked in red, including it gives us the red line):

But the other thing Mason suggests is that we can select a point along this line, which is basically an assumption about the current output gap and deviation from the trend.
...
Update, the second
Unfortunately I had to attend to some errands, and so didn't complete my thought above. Additionally, Bill in comments below hits on something relevant that I want to fold in:
However, since Sanders's proposals are radically different from US government policies in the post-WWII period, why should we expect their results to be the same?
The key point to understand is that the US economy is assumed to have a log-linear RGDP per capita that holds from 1925 until today. John Handley discusses some of the issues with that assumption at his blog here (he sent a link in comments below) -- for example demographics.
Let's suspend our disbelief for a second and take it on its face: there is a trend of 2.3% log-linear RGDP per capita growth. This trend exists from the roaring 20s, though the depression, the New Deal, WWII's top-down industrial policy, the Great Society, deregulation, Reaganomics, the 90s tech boom, George W. Bush, the housing crisis, the financial crisis, the ARRA and Obamacare.
So is the trend the result of policy?
I noted before that the recovery in unemployment has a remarkable regularity:
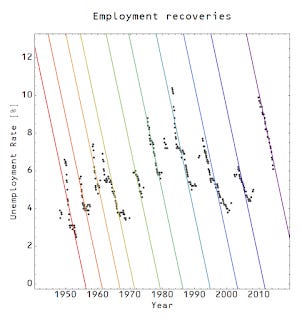
As I said there:
This regularity over several decades would imply that any mechanism that explains the rate likely has nothing to do with the internet, inequality, jobless recoveries, war, government spending, unemployment benefits, Keynesianism, monetarism, technology, ... etc. It is doubtful these different forces conspire in differing degrees to achieve approximately the same result every time.
It would be doubtful that government policy has much impact on a trend growth that purportedly holds for a hundred years (1925 - 2026). An anonymous commenter below asks:
If Sanders is planning a WWII-like mobilization, why wouldn't the data from the last one and the years preceding it be relevant?
Mason seems to agree with the anonymous commenter; they believe this kind of mobilization is plausible (such that it should be the null hypothesis -- you have to explain why it is implausible).
However, they can't have it both ways. Either 1) there is reversion to a 2.3% trend that holds over a hundred years, making the Friedman/Sanders claims plausible, or 2) policy is relevant. If it is just reversion to trend, then Trump's policies would get us there too. The plausibility claim is either banal or a massive WWII-sized mobilization.
If policy is relevant and we could implement WWII-sized mobilizations whenever we'd like, then what is keeping that 2.3% log-linear growth trend in force over a hundred years? What steps in to say: Your mismanagement of the Great Depression has gone too far from trend. Please start a world war now. What steps in to say: Your WWII expansion gone too far above trend. Please end the war now. Did WWII start because the global depression was mismanaged? I have to say: that is an interesting theory. Maybe there is something to it. But the flipside that WWII ended because we had re-established real output per capita is kind of silly: we got tired of fighting and decided to make money instead.
I mentioned the other day that the Friedman/Sanders growth claims smack of neoliberalism -- neoclassical economics in service of progressive goals. A constant growth rate of 2.3% is basically a neoclassical growth model. In that view, we let the market do its dirty business, and growth happens. At least in that case it is explicit: it is a balancing of current consumption versus future consumption that creates an equilibrium growth rate.
These are two possible implicit theories behind the prima facie "model free" acceptance of the plausibility of a 2.3% growth rate.
I have a hard time accepting simultaneously a hundred-year-long 2.3% growth trend and relevant policy. With the IT model, I actually go for the former! There are significant long-run trends in the IT model in which policy plays little-to-no role. It's fairly empirically successful, but also says post-financial crisis growth is on-trend:

This isn't constant 2.3% RGDP per capita growth, though.
...
Update, the third
If we extrapolate from our current (post-financial crisis) trend, we'd be here:

This is another way of illustrating that the assumed output gap is huge -- Friedman/Sanders takes us from the red dot to the orange dot.
You may ask why the red dot is so far from the data -- that's really an indication of how implausible the 2.3% growth trend is. If we assume a trend of 1.3% (red dot appears close to the data) or 3.3%, we get completely different figures:

...
Update, the fourth (22 Feb 2016)
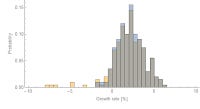
JW Mason stops by in comments below; I thought I'd illustrate the idea that the positive demand shocks have to balance the negative demand shocks to maintain a constant growth rate. I used an ARIMA process to simulate output. In one case I added large negative demand shocks (e.g. Great Depressions ... which are persistent in this model since trend growth will only slowly undo a large demand shock), and in another I added large positive demand shocks (e.g. WWII-mobilizations, which are also persistent).
Here is the first case:

And here is the second:


In the first case, the growth rate is on average lower with the large negative shocks (yellow) than without the shock (blue). In the second case, the trend is on average about the same with the large balanced shocks (yellow) and without (blue).
The negative shocks correspond to the points labelled "Great Depression" and the positive shocks correspond to the points labelled "WWII" in dark blue above.