


How does a liquidity trap work?

I've been getting in arguments with market monetarists (in particular Scott Sumner and Mark Sadowski) about the liquidity trap lately. See e.g. comments here [1] and here [2]. I don't think they understand the liquidity trap model. Maybe they just discount the model assumptions that disagree with their assumptions and are therefore effectively talking about a different model. It's possible it's my fault because I don't understand the liquidity trap argument or the monetarist argument (or both). So I decided to make some nice pictures and put forward what I think the Keynesian and the monetarist views of the liquidity trap are.
Here is the basic picture, borrowing from Figure 1 (on page 9) Figure 2 on page 13 (aka p149) [H/T Mark Sadowski] of Paul Krugman's 1998 Brookings paper (we start before the recession hits that causes the liquidity trap; Krugman starts from an economy in a liquidity trap). The dashed curve represents the Hicksian IS curve in the pre-liquidity trap picture with the black point representing the equilibrium interest rate and output (the money market equilibria at a given output are given by the gray vertical line). Suddenly a shock hits, moving the output to the left and now the set of money market equilibria are given by the red line (which would select the red point on the dashed IS curve). However, the shock also drives the IS curve to the blue curve. The equilibrium solution Z is now below the zero lower bound (ZLB), and the region where the IS curve is < 0 is shaded in blue.

Note that it is the fact that the equilibrium point Z is below the ZLB that indicates the liquidity trap, not the position of the current state of the economy in the light blue region (the red or black dots). I think this is a major source of misunderstanding between the two sides. It doesn't matter if a country has positive interest rates ... it can still be in a liquidity trap.
The first question we need to ask is: Where does the red dot go when the IS curve shifts?


The Keynesian answer: nowhere, necessarily. The IS and money markets have become disconnected and their intersection no longer determines the equilibrium. The central bank may try to move the red dot to the ZLB (zero interest rate policy, ZIRP) straight down along the red line from point #1 to point #2.
The monetarist answer? I'm not sure. The red dot may stay where it is (#1), but some evidence indicates that market monetarists think the red dot moves to the zero lower bound at point #2 or that the money curve shifts to the left, moving the equilibrium to point #3 (see figure on the left above). The latter is more consistent with the market monetarist belief that the central bank causes the recession through monetary policy.
Scott Sumner and Mark Sadowski point out that the ECB has positive interest rates, which means -- to them at least -- the EU isn't even at the ZLB. This may be evidence that the point stays at point #1 when the shock hits (like the Keynesian answer), or it may be evidence that the money curve shifts even farther to the left and the ECB is at equilibrium #4 in the figure on the right above (or even all the way over to point #5 that keeps the interest rate constant).
Only points #1, #2 and #3 could be characterized as an economy in a liquidity trap (the last one, only marginally). However, only points #1 and #2 are consistent with the modern description of the liquidity trap. Krugman states that moving to #2 doesn't hurt, and if the fall in the IS curve is slow, the equilibrium point will follow the curve down until it hits point #2. My interpretation is that Krugman believes point #1 is the EU and point #2 is the US.
The second question we need to ask is: Where does the red dot go when the central bank raises interest rates in a liquidity trap? We'll say the economy starts at point #2, which is Krugman's point #3 in Figure 1 2 in his 1998 paper (see the figure below), showing an economy in a liquidity trap.
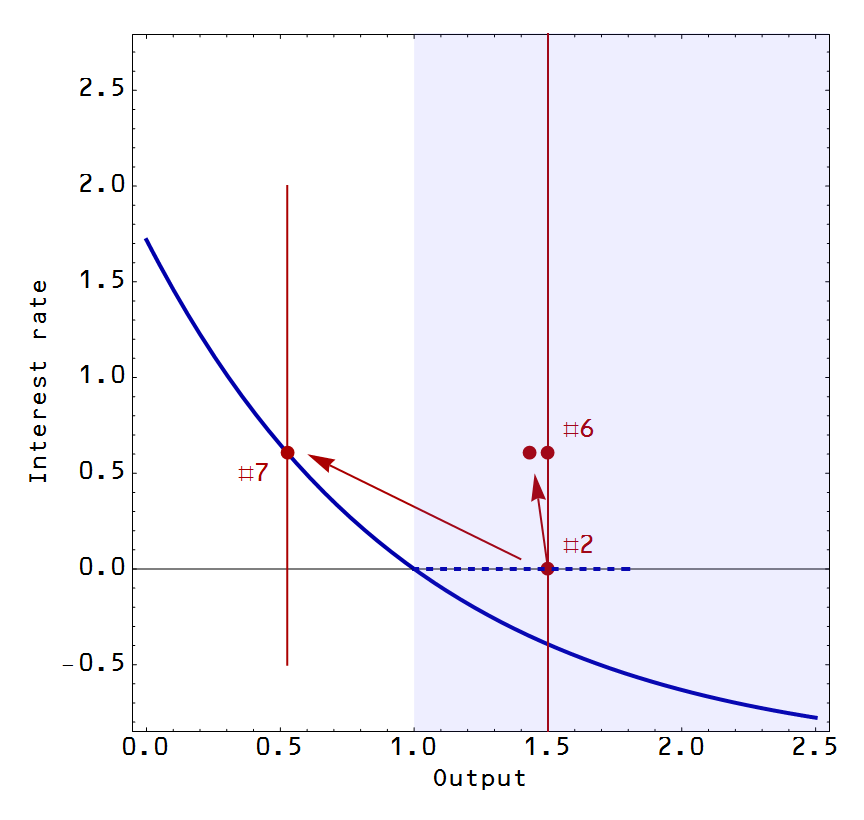
The Keynesian answer: the economy moves to point #6 in the diagram above, or possibly the point next to it. The equilibrium point is free to move up or down (at least, down to the ZLB). To leading order, the IS and LM markets are disconnected, the central bank has no traction and the effect of interest rate policy has no impact on output. Raising rates does send a contractionary signal, which can cause deflation/disinflation through expectations (e.g. the ECB raising rates in 2011) reducing output. Raising rates also will cause e.g. budget constrained EU member nations to reduce government spending and put the savings toward increased debt service. The central bank could send an expansionary signal but this is hard to do (it is hard to promise the inflation will stick around). Effectively, the central bank cannot move the red line (output) left or right.
The monetarist answer: the economy moves to point #7. The economy is no longer in a liquidity trap or at the ZLB. By assumption, the central bank can generally offset changes in output through monetary policy (moving the red line to the left or right), effectively taking the blue curve to be the dashed blue curve in the ZLB region (blue shaded region). This means that monetary policy can offset fiscal policy through its effect on output in the AD/AS model. This is the diagram monetarists say describes the ECB raising rates in 2011. (Note that point #7 here is Krugman's point #1 in Figure 1 2 in his 1998 paper, which shows an economy that's not in a liquidity trap.)
The third question we need to ask is: How do we get back to pre-recession output?
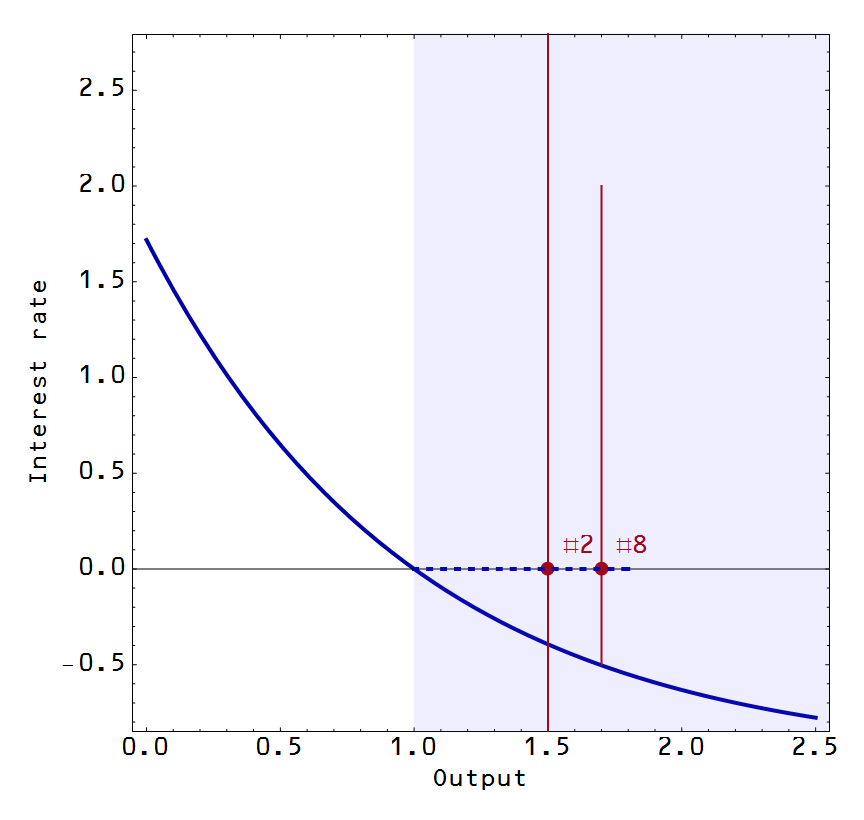
The Keynesian answer: fiscal stimulus is the only thing that will move us from point #2 to point #8 in the diagram above. In terms of monetary policy, we're stuck at point #2.
The monetarist answer: if the central bank targets the output level given by point #8 (moving the red line to the right), we can move along the dashed blue curve to point #8. Monetary policy effectively selects the level of output ... by assumption.
The fourth and final question we need to ask is: Which answers are right?
This is the Keynesian/Hicksian/Krugmanian liquidity trap model, so I'd defer to those answers for how a liquidity trap works. But I think I've captured where different model assumptions enter. Because macro data is uninformative, the argument between both sides tends to take the form of "obviously the (Keynesian/monetarist) model assumptions are correct" and "such and such random piece of (monetarist/Keynesian) model confirming data show that the (Keynesian/monetarist) model is wrong". Neither side cedes that model assumptions on the other side could be correct, nor do many of the blog posts out there look at all the data together. The two sides are talking past each other. They have different models and assumptions and each side doesn't believe the other one.
Now I believe the evidence is strongly in favor of the liquidity trap model, at least for the US, Japan and the EU. The information transfer model allows both explanations to exist, but selects which one based on the empirical data. It favors the liquidity trap view in the case of Japan, the US and the EU. It favors the monetarist view for countries like Canada, Australia and Sweden. In order to do this, it looks at all of the data (price level, NGDP, monetary base, and interest rates) together.
Now maybe the information transfer model is incorrect, but at least it doesn't assume the result.