Heterogeneous labor supply shocks
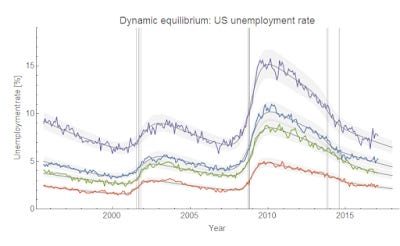
FRED posted a tweet linking to a graph of the unemployment rate by education level. I thought I'd try the dynamic equilibrium model out on it:

One of the interesting things is that while the dot-com bust and the housing bust/financial crisis hit all levels at roughly the same time (vertical lines in 2001 and 2008), the 2014 boom hits the lowest education levels first, followed by the higher levels. That boom might have already passed for those with less than a high school diploma (and might be a leading indicator of a future recession).
Another interesting thing is that the logarithmic rate of decline is roughly the same in each case (from highest education to lowest it is 0.087, 0.070, 0.091, and 0.081 (multiply these by 100 to get a rough estimate of percent decline per year). That is to say that while the shocks may appear at different times, the process of the unemployed finding work is roughly the same for all education levels.
[Update 10 October 2018: In thinking about this a bit more, while these are roughly the same, the matching rate for "some college" (0.070/y) is significantly less than the others. Discussed more here.]
...
Update 3 February 2017
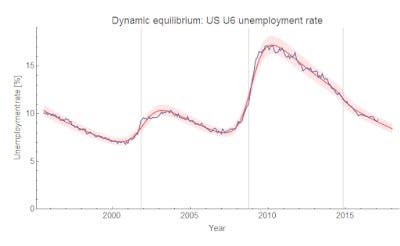
I just wanted to note that the U6 unemployment rate tells basically the same story (rate of decline is 0.087 just like the others):

This means that given the U3, I could derive the U6 rate (as well as the rates for different education levels).


