Employment-population ratio and labor force participation rate

I haven't updated the forecasts of labor force participation for ages 25-54 or the employment population ratio by gender in awhile. I was prompted by this tweet from Ernie Tedeschi about how labor force participation hasn't abated — but it shouldn't show any signs until after a recession has already hit (here, here). Here are the updated models for labor force participation and women's employment-population ratio:


For some reason I don't fully understand, the code for men's employment-population ratio had the dynamic equilibrium hard coded to 0.007/year when the actual solution from the entropy minimization was 0.005/year. It's the latter value that matches the original fit while also fitting the post-forecast data, but I'll present both graphs — the 0.007/year value is the one that shows recent data lagging the forecast. My guess for the reason was that I was comparing the value for the fit for women in the graph above (which is 0.007/year) and forgot to change it back or document it. Anyway, here's the E-POP ratio for men with both dynamic equilibria:


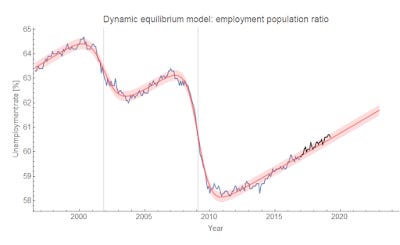
Last but not least is the employment population ratio for everyone in the labor force — which has a forecast from the CBO to compare to (again, via Ernie Tedeschi) ...

... that's doing poorly.
I added the CBO's August 2018 projection from Ernie's graph. Here's the longer run (the graph above was made to match Ernie's tweet):