


Dynamic equilibrium: the price of gold (and oil)

As I talked about here, information equilibrium models of prices should manifest dynamic equilibria (subjected to exogenous shocks). I tried it on the S&P 500, but I thought I'd try it on a commodity: gold. Here are the results:

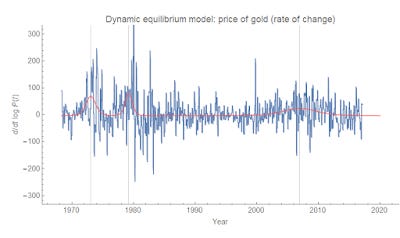
The transitions are at 1973.1 (the convertibility shock), 1979.2 (inflation/oil shock?), and 2007.0 (the long post-9/11 shock). What is also interesting is that in the absence of exogenous shocks, the (nominal) price of gold tends on average to fall slowly (about 2.7% per year).
The Mathematica code up on the dynamic equilibrium GitHub repository (FRED data I used is here; I used the monthly averaging option).
...
PS Also, there's this post on gold. And this one.
...
Update 2 March 2017
Here's another commodity (added to title as well): oil ... two different measures (West Texas and Brent)
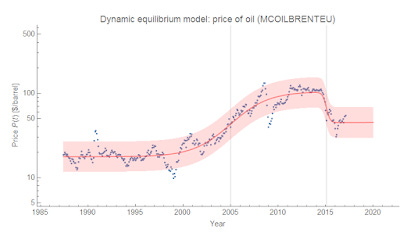

The transitions are at centered at 2004.6 and 2015.0 (West Texas) or 2005.0 and 2015.1 (Brent). The former could be due to the Iraq war or the global economic boom. The latter is likely the OPEC decision to increase production to make oil shale production in the US and Canada unprofitable.
The rate of growth absent the shocks is not statistically significantly different from zero.