


Compare and contrast

This post isn't going to be about market monetarism per se, but rather about what it means to predict things -- what it means to get things right. Let me illustrate with two examples that take on the same two subjects: low trend growth and interest rates and the Swiss Franc. One example is Scott Sumner (conveniently in a single post) ...
On low interest rates and lower trend growth:
It wasn’t expected by everyone, but MMs have been predicting this for quite some time (although they are even lower than I expected) ... Of course Summers was a latecomer to this idea; I’ve been talking about slower trend growth and low interest rates as the new normal for many years.
And on the Swiss Franc:
And as predicted by MMs, the Swiss decision to revalue the franc has backfired. Now that markets understand that the Swiss are willing to let the SF appreciate over time ... The pro-revaluation crowd thought that the SF would no longer be expected to appreciate, if speculators could be placated with a revaluation upwards.
...
The other example is, well, me ...
... I'd hazard a guess that the IE model predictions will be better than the BCEI predictions. If the Fed goes through with its projected short term rate increase in September-ish time period, it could impact this projection, but only if the Fed unwinds a large fraction of the QE in the short term.

... The model (green line) shown in all of the graphs above is actually the model fit using all of the data from 1960 to 2015. However, the projections only use the model fit to the data from 1960 to the projection year (1996, 1999, 2005, 2010, 2015). This is visible in some of the projections above as the start point of the projection is noticeably off of the green line (2005 is the most visible, 1999 is the second most visible).
The model fit for 2015 is:
log r = k₁ log(N/M) - k₂
with
k₁ = 2.8
k₂ = 6.4
Using FRED series M = MBCURRCIR [converted from millions to billions of dollars], N = GDP and r = GS10.
You can have a look at the model here (with fit parameters):
On the Swiss Franc:
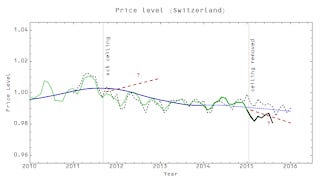
... I normalized the two HICP series by scaling the core HICP to minimize their difference between Jan 2011 and Jan 2014. The red lines are just general directions of the impact of imposing and removing a ceiling based on standard monetary economics. The IT model predicted that there would just be a continuation of the slight downward trend.
So what happened? Oil, not monetary policy. The oil price fell drastically, bringing down the headline HICP number
...
In both cases, we have essentially correct predictions. In one case, it is for qualitatively lower growth and lower interest rates (even lower than Sumner expected), and qualitative changes in expectations resulting in the non-realization of a counterfactual path (Swiss Franc).
In the other case we have quantitative prediction (in an easy to find location -- see the link to this page on the sidebar) of specific variables over a specific time period using a well-documented model -- alongside direct comparisons with other models and/or theories.
Now some economists and econoblogosphere commenters out there say economics isn't really about quantitative predictions. And that's fine when both the specific qualitative and quantitative forecasts turn out to be wrong (see above or e.g. here). Maybe it is too difficult to make specific predictions for a complex nonlinear system.
And the choice is obvious when either the qualitative or the qualitative approach is right and the other is wrong (i.e. choose the right one).
But both the qualitative and non-specific as well as the quantitative and specific predictions above were right. And they represent entirely different models. What should you think in that case?